Welcome to Flow and Load Duration Curves for TMDL project!
This project assists in creation of professionally looking Flow and Load Duration Curve plots.
Code moved to https://github.com/mlt/miscelrneous/tree/master/pkg/tmdl
Goal
The goal of this project is to provide easy to use tools
to facilitate the process of TMDL development
This project is for you if you are
- working on TMDL
- tired from doing routine operations in your favorite spreadsheet
- not satisfied with charting capabilities of your favorite spreadsheet
- not well familiar (at least at this moment) with R and wonderful package lattice.
Features
- Flow and Load duration curves
- Monthly flow variation plot
- Box plots with mean & median and whiskers at 10th and 90th percentiles as used in most TMDL studies
(Default whiskers of boxplot function in R stretch to 1.5 IQR)
- MOS can be calculated as % from TMDL or as a difference between TMDL for low and median flows within each hydrological interval
Vignette
This vignette requires SVG enabled browser.
Firefox should be fine, however default Internet Explorer may not work without proper plugin.
Download
For some reason windows binary build is currently broken on R-Forge, so here is some snapshot tmdl_0.4-0.zip
Example plots
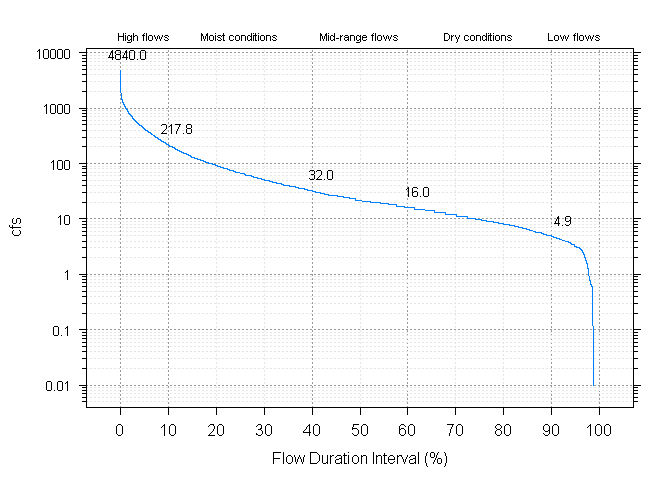
Flow duration curve
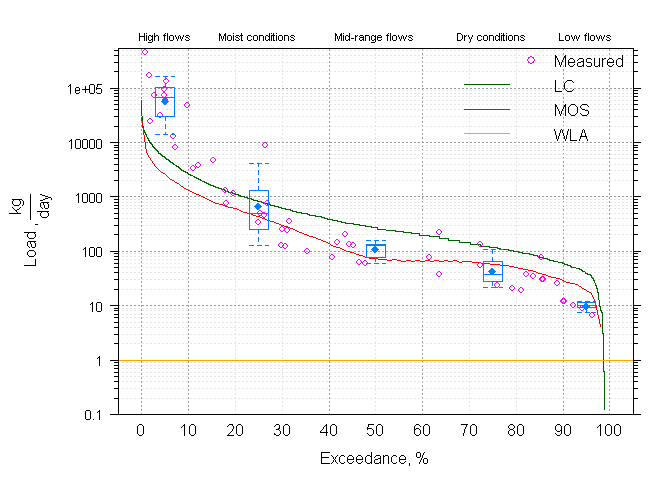
Load duration curve
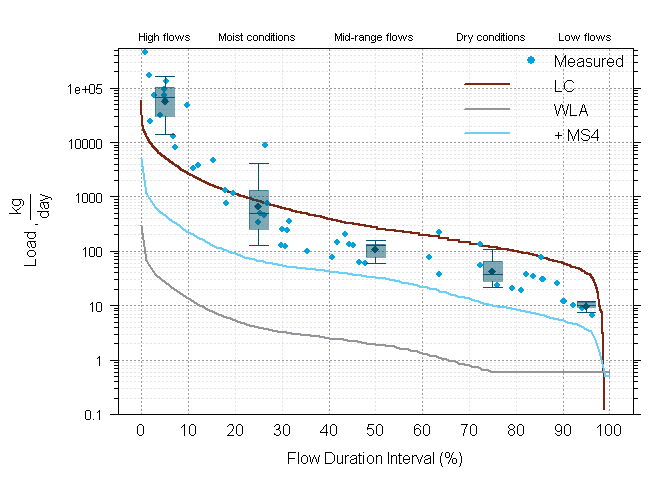
Load duration curve with custom theme
The project summary page you can find here.